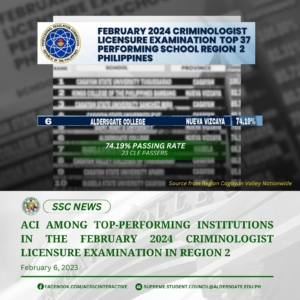
Archives
209396
Users Today : 213
This Month : 3386
This Year : 66439
Total Users : 199132
Views Today : 487
Total views : 922420
Your IP Address : 3.233.219.103
Server Time : 2023-06-08

The Learning Styles of First Year Tertiary Students of Aldersgate College…

Background of the Study

In today’s global society, foreign language skills have become vital to the children’s future as members of the workforce and to the nation’s future success in the world. The learning of a second language is a complex process, involving a seemingly infinite number of variables. The school plays a great role in the second language learning as it endeavors on the effectiveness of its curriculum. In the light of second language learning, the school through its educators must place emphasis on intuition, feeling, sensing, and imagination, in addition to the traditional skills of analysis, reason, and sequential problem solving.

The teachers should design instructional methods to connect with learning styles, using various combinations of experience, reflection, conceptualization, and experimentation. Instructors can introduce a wide variety of experiential elements into the classroom, such as sound, music, visuals, movement, experience, and even talking. The Teachers should employ a variety of assessment techniques, focusing on the development of “whole brain” capacity and each of the different learning styles. By understanding the learning styles of the students, their environment can be tailored and they may be taught with some tips to help them succeed in school and in life.

This study was anchored on the different learning styles of second language learners which were the bases for designing a task-based syllabus. It worked on the balance of learning styles among students who tend to be single-sided in the learning process. Being flexible in the process maximizes the opportunities of students to learn new interesting things in language learning which they can put into practice.

Research Problems

1. What is the profile of the first year students of the different colleges of Aldersgate College as to:

1.1.      Age?

1.2.      Gender?

1.3.        Parents’ Income?

1.4.        Parents’ Occupation?

1.5.        Technological Media and Reading Materials at Home?

1.6.        Number of Siblings?

1.7.        College enrolled in?

1.8.        Language Spoken at Home

2. What are the dominant learning styles of the first year tertiary students of the different colleges of Aldersgate College based on the following?

2.1.     VAK Learning Styles Test

2.2.     KOLB’S Learning Style Inventory

2.3.     Index of Learning Styles Questionnaire

3. Is there a significant difference on the learning styles of the first year tertiary students of Aldersgate College when grouped according to colleges?

4. Is there a significant relationship between the learning styles of the first year tertiary students of Aldersgate College when grouped according to the profile variables?

5. What are the implications of the result of the assessment on the learning styles of the first year tertiary students of Aldersgate College to task-based learning?

Respondents of the Study

The study was conducted to the 262 respondents who are first year college students enrolled at Aldersgate College this second semester school year 2007-2008.  The respondents were purposively chosen as the study covered all first year students enrolled in the different degree and non-degree programs of Aldersgate College.

The succeeding table is a matrix of the respondents who are first year tertiary students categorized according gender and course enrolled in Aldersgate College. These are the courses offered under the five college departments of the school: College of Arts Sciences and Education (CASE); College of Business and Information Technology (CBIT); College of Engineering and Technology (CET); School of Criminology (SC); and School of Medical Sciences (SMS).

Findings

Profile of the Respondents

Age

The respondents are within the normal age range of first year tertiary students with the mean age of 18.37 or with ages falling under the 17-19 age group.  The small discrepancy from the normal age of 17 is accounted by students who entered college after some time or students who shifted from one course to another.

Gender

The gender breakdown of the first year tertiary students of Aldersgate College is 116 or 44.27% males and 146 or 55.73% females. SMS, CASE and CBIT are dominated by female students and the courses under the SC and CET register more males.  The difference in the number of females over males is equivalent to 11.46%.

Parents’ Income

The overall mean of the respondents’ combined parents’ income  is Php 10240.58 or between Php 6000-12000.

Parents’ Occupation

There are 32 occupations in which the parents of the respondents are classified. Farming is the primary source of most families the respondents belong to. One hundred twelve (112) or 42.75% of the respondents have parents who are farmers. Seventy eight (78) or 29.77% of the respondents have parents who engage in housekeeping. Third among the occupations is the Overseas Foreign Worker (OFW) with 48 respondents or 18.32%. Other occupations of the respondents’ parents are business (39 or 14.89%); driving (33 or 12.60% ); teaching (18 or 6.87%); carpentry (13 or 4.96%); government employee (9 or 3.44%); Police/Military Service ( 6 or 2.29%); politics (5 or 1.91); engineering and vending (4 or 1.53%); clerical, mechanic, medical practice and school administrator (3 or 1.15%); cashier, nursing practice and retirees (2 or 0.76%);  apartment caretaker, bank employee, dentist, electrician, fisherman, forester, hairdresser, human resource officer, nutritionist, preacher, student, tailor and welder (1 or 0.38%).

Technological Media and Reading Materials at Home

One hundred eighty seven or 71.37% of the respondents have books which are most remarkable among the print materials; 182 or 69.47% have dictionaries at home; 128 or 48.85% have magazines; 106 or 40.46% have newspapers; while only 47 or 17.94% of the respondents have educational journals at home. With regards to non-print materials, the television ranks first with 235 respondents or 89.69%, followed by cellular phone (203), radio (197), and DVD/VCD (174) which are all marked with high frequencies, meaning they are considerably found in the homes of the respondents as technological media from which they can get information. Other materials which are not so common among the respondents are electronic learning packages (49), computer without internet (40), computer with internet (23) and hard phone (19). These electronic gadgets are least in count because of the cost they require.

Number of Siblings

With respect to the number of siblings, 44 or 16.79% of the respondents have five (5) siblings or more. Thirty nine respondents or 14.89% have 4 siblings. Moreover, 67 of the total respondents or 25.57% have three (3) siblings under which sibling group fall most of the respondents. Next in frequency is the sibling group of two(2) with 58 or 22.14% of the respondents. The sibling group of one (1) has classified under which 44 respondents or 16.79%. Only 10 respondents or 3.82% belong to a family with no siblings.  Considering the overall mean number of siblings which is 2.81, the respondents in general fall under the three-sibling group which indicates that most of the first year tertiary students of Aldersgate College belong to a family of four kids.

College enrolled in

Highest in terms of college size is the School of Medical Sciences with 139 or 53.06%. Following are the College of Business and Information Technology whose respondents sum up to 65 or 24.81% and the College of Engineering and Technology with 27 respondents or 10.30%. The school of Criminology registers 19 respondents or 7.25% while the College of Arts Sciences and Education comes with the least number of respondents at 12 or 4.58%.

Language Spoken at Home

There are fourteen (14) languages which the freshmen students of Aldersgate College use to communicate at home. The Ilocano language takes 215 of the respondents or 82.06%. The Tagalog language comes next with 41 or 15.65%. Ifugao and Kalanguya speakers as well belong the top array of frequently spoken languages with 19 or 7.25% and 8 or 3.05% respectively. Both Gaddang and Isinai speakers take the fifth slot with 4 respondents or 1.53% each. Other languages are Bisaya (2), Waray (1), Cebuano (1), Bontoc (1), Itawes (1),  Pangasinense (1), Ibanag (1) and English (1).

Learning Styles of the Respondents based on VAK Learning Styles Test, KOLB’s Learning Styles Inventory and Index of Learning Styles

VAK Learning Styles Test

The visual learning style is most dominant among the first year tertiary students which take 184 or 56.49% of the total number of respondents.  The respondents rated themselves on this level with an overall mean of 3.27 which falls in between two options: Sometimes Applies (3) and Often Applies (4).  Next in frequency are the respondents who were categorized as auditory learners with 65 of them or 24.81% with an overall mean of 3.08 under this style, meaning the set of auditory statements in the VAK Test sometimes applies to them. The respondents manifested least preference on the kinesthetic style of learning with 49 respondents or 18.70% falling under this group. The respondents rated themselves 2.96 on the average as to their ability to learn kinesthetically. This figure is found in between the descriptive options: Applies Once In A While (2) and Sometimes Applies (3).

KOLB’S Learning Style Inventory

There are no immense differences in the number of respondents classified under the four learner types according to frequencies for each type. There are 69 respondents or 26.34% who belong to the pragmatist group (Concrete Experience); 67 or 25.57% to the reflector group (Reflective Observation); 65 or 24.81% to the activist group (Active Experimentation); and 61 or 23.28% to the theorist group (Abstract Conceptualization).  The mean ratings of the respondents from the inventory were obtained as well. It can be made out that respondents are reflectors in general with mean rate of 18.93, followed by theorists with mean of 18.73, activists with mean of 18.52 and pragmatists 17.58.

Index of Learning Styles Questionnaire

1.       Active versus Reflective

The respondents register a mean rating of -0.01 under this category which implies that they are more inclined to be active learners over reflective learners.

2.       Sensing versus Intuitive

The respondents coming from the five college departments are sensing learners as compared to intuitive learners, since the mean is -2.22.

3.       Visual versus Verbal

The mean rating of 0.73 is the outcome of the index under this category which implies that the respondents tend to be more verbal than visual.

4.       Sequential versus Global

While some are fairly well categorized as global, the respondents in general are sequential learners based from the index mean of 0.93.

The difference between the learning styles of the first year tertiary students of Aldersgate College when grouped according to the college

There is no significant difference between the learning styles of the respondents when grouped according to colleges they enrolled in. The F-ratios computed in all the learning styles categories fall between the range of + and – 2.41. This denotes that for all categories, the Null Hypothesis is accepted.  This means that the learning styles of the students do not vary or are not determined by the college they enrolled in.

The relationship between the learning styles of the first year tertiary students of Aldersgate College when grouped according to the study variables

Age

The VAK Test yields that there is no significant relationship between the learning styles of the respondents and their ages as indicated by the values of 0.41 (low correlation) and 0.21 (very low correlation) for the visual and auditory styles.  Conversely, the correlation value for the kinesthetic style is -0.52 (high correlation).

There is no significant relationship between the learning styles of the respondents according to KOLB’s Inventory and their ages as indicated by the values of -0.05 (very low correlation), 0.19 (very low correlation), -0.39 (low correlation) and 0.16 (very low correlation).

There is no significant relationship between the learning styles of the respondents and their ages as indicated by the values of -0.03 (very low correlation), 0.28 (low correlation) and 0.19 (very low correlation) in three domains of the Index of Learning Styles which mean that the ages have weak relationship with the learning styles of the respondents.  The null hypothesis is therefore accepted. However, it can be noted that in one domain, ACT-REF, the r value of -0.91 shows a very high correlation, thus in this particular domain the null hypothesis is rejected, meaning there is a significant relationship between the ACT-REF learner type and the ages of the respondents.

Combined parents’ income

There is a significant relationship between the income of the parents and five of the domains of the learning styles, namely visual and kinesthetic types under VAK Test; and reflector, theorist and activist types of the KOLB’s Test.  All the computed values in this types which are -0.92 (very high correlation) for visual and -0.78 (very high correlation) for kinesthetic, both under the VAK Test; 0.60 (high correlation) for pragmatist, 0.95 (very high correlation), 0.71 for theorist (high correlation) and 0.74 (high correlation) under the KOLB’s Inventory; 0.57 (high correlation) for ACT-REF and 0.60 for SEN-INT, both under the Index of Learning Styles.  Three of the types however indicate that there is no significant relationship between the income of the parents and the learning styles of the respondents. Computed correlation values of these types are -0.06 for auditory under VAK Test; 0.12 for VIS-VRB and 0.20 for SEQ-GLO under the Index of Learning Styles.

Parents’ occupations

The computed correlation values for all the domains of the learning styles tests used in the study are classified to have very low correlations ( scores between 0 and + or -0.25).  Hence, there is no significant relationship between the learning styles of the respondents and their parents’ occupation.

Technological media and reading materials present at home

The computed correlation values for the technological media and reading materials at home versus the learning styles of the respondents are: visual (-0.73, high correlation) and kinesthetic (-0.54, high correlation) under the VAK Test and theorist (-0.53, high correlation) and activist (-0.73, high correlation) learner types under the KOLB’s Tests. All other domains of the learning styles tests used in the study indicate that there is a low if not very low correlation between the learning styles of the respondents and technological media and reading materials present at home. Thus, there is no significant relationship between the learning styles of the respondents and the technological media and reading materials present at home.

Number of Siblings

The calculated correlation values for visual (0.57, high correlation), reflector (-0.52, high correlation), theorist (-0.58, high correlation), activist (-0.83, very high correlation), ACT-REF (-0.80, very high correlation), SEN-INT (0.68, high correlation) and VIS-VRB (0.82, very high correlation), means that there is a significant relationship between the learning styles of the respondents and their numbers of siblings.

In the domains of auditory, pragmatist and SEQ-GLO, the computed correlation values are less than 0.5 which means that there is no significant relationship between these learning styles of the respondents and the number of siblings,

College enrolled in

The computed correlation values for all the domains of the learning styles tests used in the study range from -0.47 to 0.25 which values denote low or very low correlation. These data indicate that there is no significant relationship between the learning styles of the respondents and the colleges they enrolled in.

Languages spoken at home

With values less than + or – 0.25, the computed correlation for all the domains of the learning styles tests used in the study are classified to have very low correlations.  This indicates that there is no significant relationship between the learning styles of the respondents and languages spoken at home.

Recommendations

The language teacher should regard learning to have involved experiences ranging from varied tasks because the ideal training environment would include processes implicated by the different learning styles. This will be indicated in a task-based syllabus which the researcher recommends for use. The classroom activities should be flexible so that each learner could spend additional time on his or her preferred learning style.

2.       The language teacher should be trained how to extract the learning styles of the learners so they could tailor their teaching styles to suit those of their students. The researcher envisions an Advanced Teaching Competencies Training Program which will be initiated as part of this study.

3.       A set of work texts should be prepared at the beginning of a school year after having extracted the qualities of the learners. The researcher recommends the use of the Work Texts prepared for the Communication Arts I an II through this study.

4.       Putting the Styles Together. First, it should be noted that no single measurement of style ensures that a learner’s needs will be met. It is perhaps more important to build an adaptable learning environment that presents the material in a variety of methods than try to determine each learners personal style. Likewise, recognizing your own style will help to ensure you do not unintentionally force one learning method upon the learners. The more styles you address, the easier the instruction will be received by the learners. This is because you will be striving to reach their needs, not yours. Also, material presented in a variety of methods keeps the learners interested and reinforces itself.

5.       The visual learners like most of the respondents like to learn through written language, such as reading and writing tasks. They remember what has been written down, even if they do not read it more than once. They like to write down directions and pay better attention to lectures if they watch them. Learners who are visual spatial usually have difficulty with written language and do better with charts, demonstrations, videos, and other visual materials. They easily visualize faces and places by using their imagination and seldom get lost in new surroundings. The researcher therefore recommends that the language teachers should prepare a curriculum/syllabus which suits the visual learners but not disregarding the fact every learner can make use of the different learning styles at some extent in varied learning experiences.

6.       Further studies should be made on the effectiveness of a task-based program which will help optimize the learning process which eventually benefits not only the institution but the classroom teachers, students and parents as well.

7.       The results of the sudy should be presented to the faculty members of the college through the Advanced Teaching Competencies Training Program (ATCTP).

8.       The Work Texts prepared for the Communication Arts I an II should be submitted to an expert for cross-validation.